Time-Series ML · Sensor Data · Web Bluetooth
Shot Gyro
A PlayStation 5 DualSense controller repurposed as a 6-axis IMU sensor for shooting-sports motion analysis — a webapp collects gyro/accelerometer data over Web HID, Label Studio annotates the shot phases, and change-point detection segments the signal.
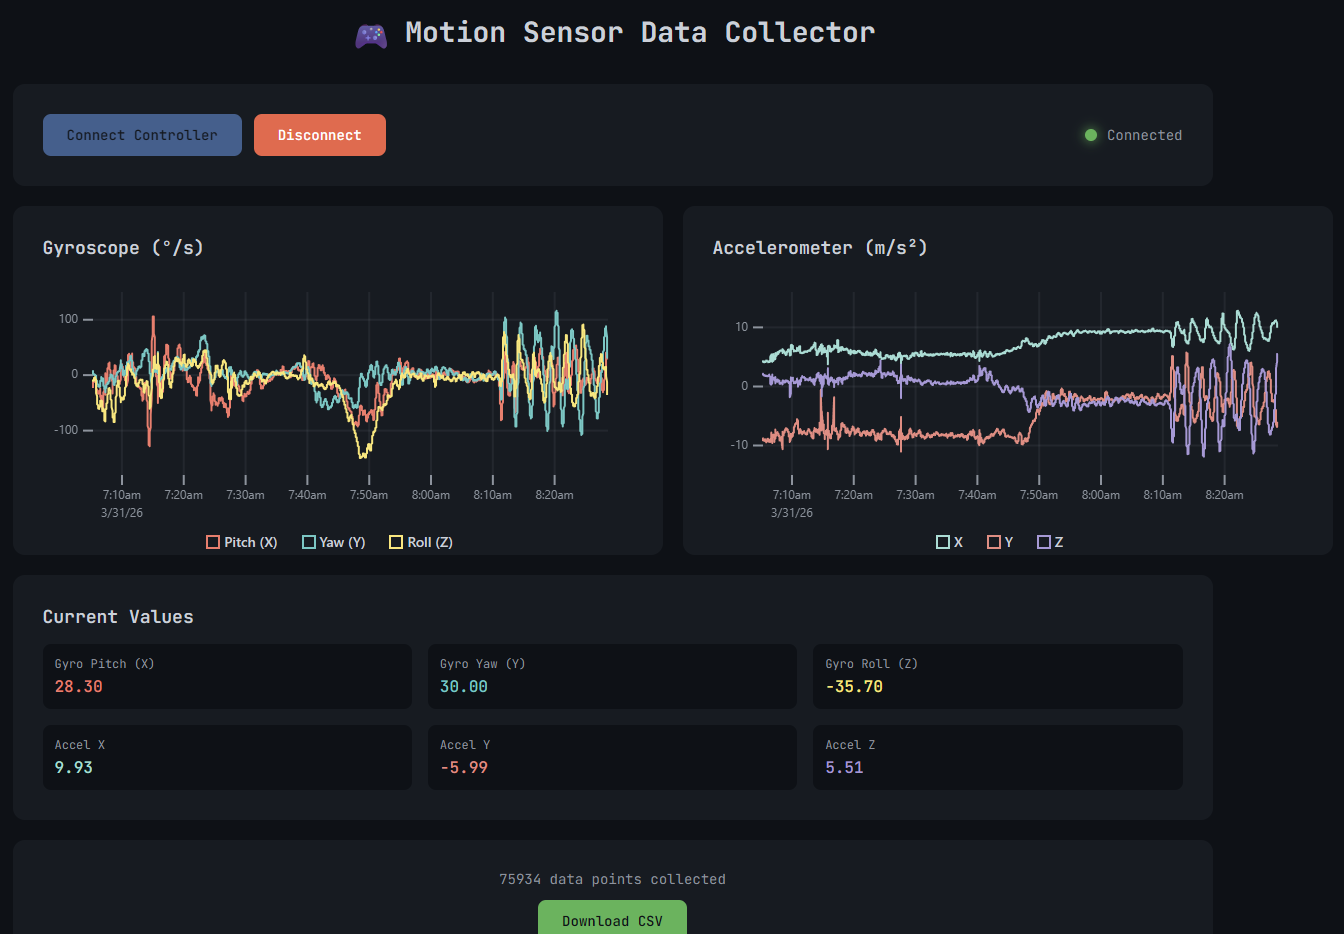
A games controller strapped to a shooter’s hand becomes a motion-capture rig. Shot Gyro turns a PlayStation 5 DualSense — which carries a 6-axis IMU — into a data-collection instrument for shooting-sports technique analysis. A browser app streams the gyro and accelerometer at ~125 Hz, the recordings are hand-annotated by shot phase in Label Studio, and a change-point detection pipeline segments the raw signal into individual shots.
The idea
Quantify a shooter’s motion without a lab.
A pistol shot is a short, repeatable sequence: rest, lift to the target, aiming, the shot break, and follow-through. Every phase leaves a fingerprint in the inertial signal — the lift is a slow angular sweep, the aim is a high-frequency tremor that settles, the shot break is a sharp impulse, and the follow-through is the recoil decay. If you can capture that signal cheaply and label the phases, you can start to measure, compare and coach technique.
The DualSense controller is an off-the-shelf IMU platform: a 3-axis gyroscope and 3-axis accelerometer streaming over Bluetooth HID at roughly 125 Hz, with no firmware to write and no driver to install — the browser talks to it directly. The work splits into three layers:
- Collect — a Web HID app connects to the controller, parses the HID input reports into physical units, visualizes the live signal on uPlot charts, and exports timestamped CSV.
- Label — the CSV is loaded into Label Studio, where each recording is hand-annotated across five shot phases over all six sensor channels.
- Analyse — a Jupyter notebook loads the labelled data, visualizes it
with Plotly, and runs
ruptureschange-point detection to segment the gyro signal into individual shots automatically.
System architecture
The diagram shows the full path: the DualSense’s HID input reports flow through the Web HID app into CSV files, which Label Studio annotates and the analysis notebook segments with change-point detection.
6-axis IMU
gyro + accel · ~125 Hz"] subgraph web["Web HID app (browser)"] HID["navigator.hid
requestDevice + open"] PARSE["HID report parser
int16 → deg/s & m/s²"] CHART["uPlot live charts
gyro + accel"] CSV["CSV export
timestamp + 6 axes"] end subgraph ls["Label Studio"] ANN["TimeSeries annotation
Rest · Lift · Aiming · Shot · Follow"] end subgraph nb["Analysis notebook"] PD["pandas
resample · interpolate"] PL["Plotly
signal visualization"] RPT["ruptures Dynp (l2)
change-point detection"] end DS -->|"Bluetooth HID
input report 0x01"| HID HID --> PARSE PARSE --> CHART PARSE --> CSV CSV --> ANN ANN --> PD PD --> PL PD --> RPT
1. Data collection (webapp)
The collector is a single-page web app that talks to the DualSense directly through the Web HID API — no native driver, no Bluetooth stack configuration, just a browser (Chrome/Edge) and a paired controller.
The DualSense as a sensor
The controller contains a 6-axis IMU exposed through its standard HID input
report (report ID 0x01):
- Gyroscope — 3-axis angular velocity in degrees/second (raw int16 ÷ 1024).
- Accelerometer — 3-axis acceleration in m/s² (raw int16, scaled by 8192 res/g × standard gravity).
The app requests the device with navigator.hid.requestDevice() filtered to
the Sony vendor ID (0x054C) and the DualSense product ID (0x0CE6) — with
DS4, DualSense Edge and PSVR2 controllers also accepted — opens the HID
interface, and subscribes to inputreport events.
HID report parsing
Each input report is a DataView over a 74-byte buffer. The motion data sits
at fixed offsets:
- Gyroscope X/Y/Z — int16 little-endian at offsets 16/18/20, divided by 10.
- Accelerometer X/Y/Z — int16 little-endian at offsets 22/24/26, converted through the accelerometer resolution (8192 counts per g) to m/s².
The parser also sends output reports back to the controller — a 77-byte
Bluetooth output report with CRC32 checksum, sequence numbering and the
0x10 report type — to initialize the controller into a known state (lightbar
colour, motor off) on connect.
Live visualization
Two uPlot charts render the gyro (pitch/yaw/roll) and accelerometer
(X/Y/Z) in real time. The app uses pre-allocated 5000-point ring buffers with
a slice/concat update pattern and batches redraws through
requestAnimationFrame, so it keeps up with the ~125 Hz report rate without
dropping frames.
CSV export
Every sample is stored with an ISO-8601 timestamp (millisecond precision) and exported as:
timestamp,gyro_x,gyro_y,gyro_z,accel_x,accel_y,accel_z
2026-03-27T17:41:12.345Z,0.12,-0.05,0.08,...
Recordings are named with the shot count and context
(dualsense_motion_2026-03-27T1741_10_skott.csv) so the dataset is
self-documenting.
2. Annotation (Label Studio)
The collected CSVs are loaded into Label Studio as time-series tasks.
The annotation config (labelstudio/annotation_setup.xml) defines five labels
mapped to the phases of a shot cycle, each painted directly onto the six
sensor channels:
| Label | Meaning |
|---|---|
| Rest | Controller stationary, shooter not in position |
| Lift | Raising the pistol toward the target |
| Aiming | Settling on target, fine angular corrections |
| Shot | The trigger break and recoil impulse |
| Follow | Follow-through, recoil decay and hold |
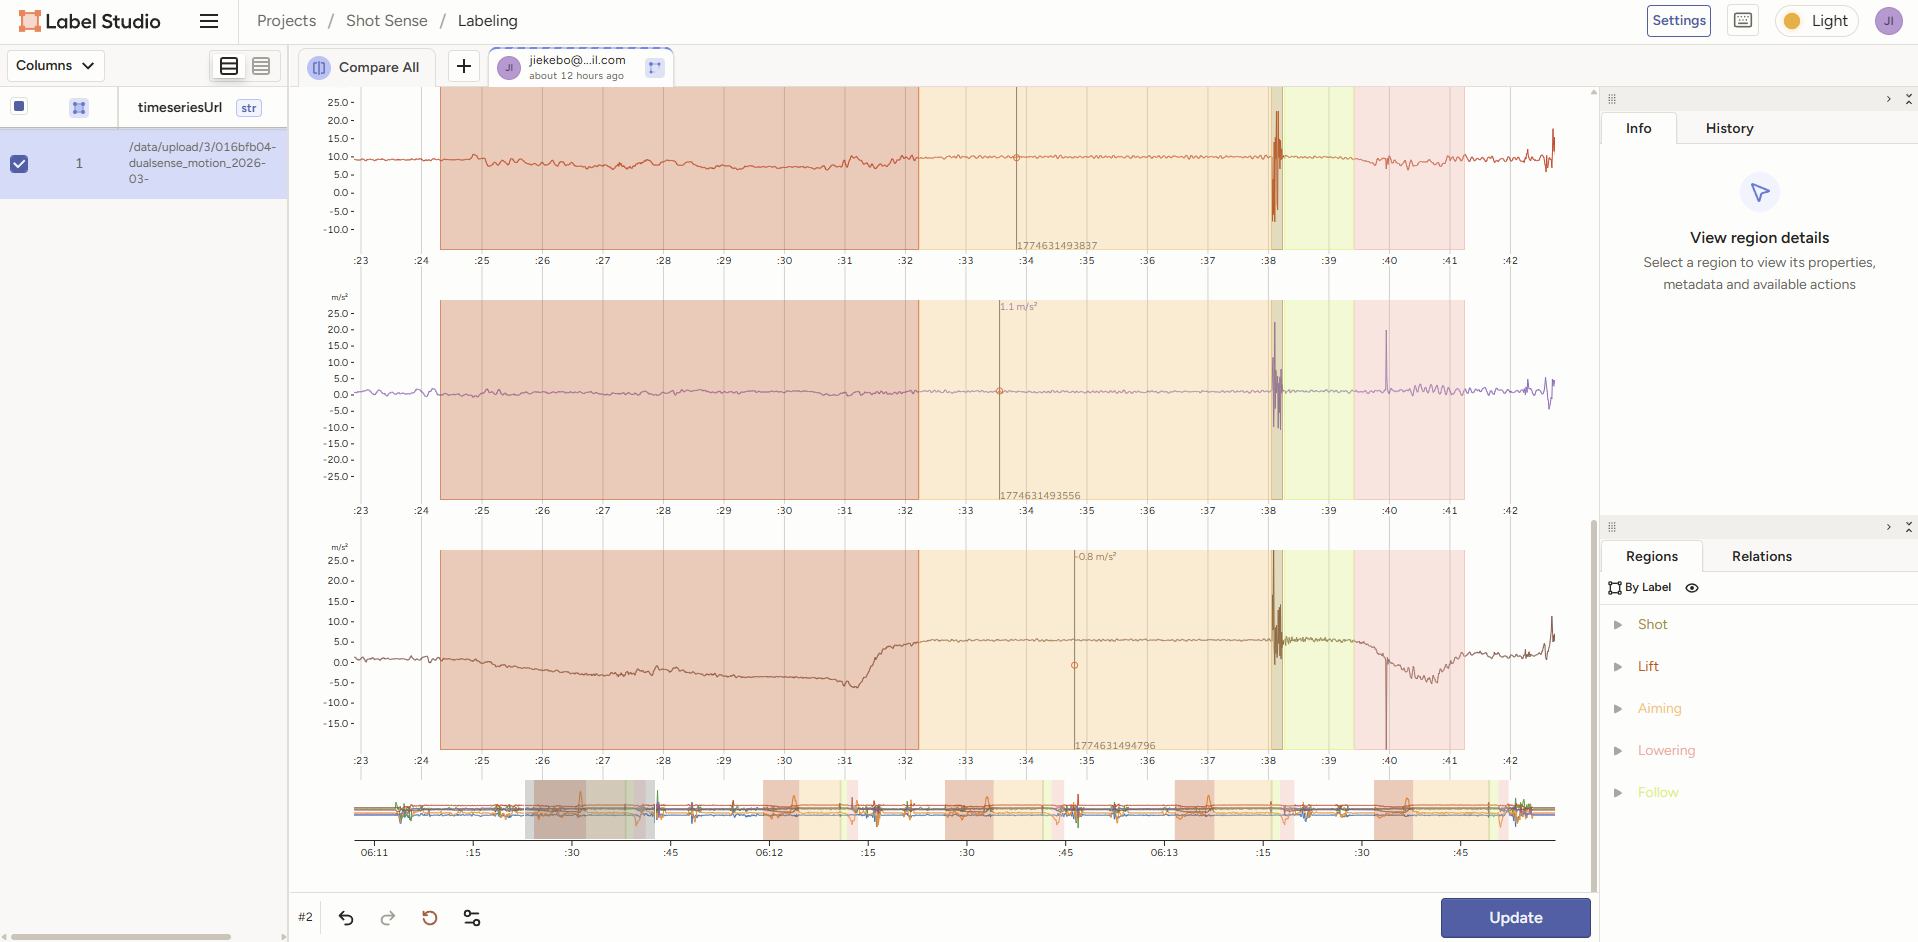
Each of the six channels (gyro_x/y/z, accel_x/y/z) is rendered with its
own stroke colour, and the annotator brushes the phase labels over the
regions of interest — producing a supervised segmentation ground truth that
the analysis pipeline can be evaluated against.
3. Analysis (notebook)
notebooks/shot_analysis.ipynb is where the raw recordings are cleaned,
visualized and segmented:
- Load & resample —
pandasreads the CSV, parses the timestamp index, resamples to a uniform 1 ms grid and interpolates. The DualSense reports arrive at ~1 ms but with duplicate timestamps, so resampling is what makes the signal analysable. - Visualize — Plotly line charts of the gyro and accel axes, both full-range and zoomed to the shooting window, plus a differenced view to highlight impulse events like the shot break.
- Change-point detection —
ruptureswith theDynp(dynamic programming) search and anl2cost model segments the gyro-Y signal inton_bkpspieces. Each detected breakpoint corresponds to a transition between shot phases, giving an automatic segmentation that can be compared against the hand-labelled ground truth.
The dataset
The recordings live in data/sensor_data/ and cover multiple sessions,
shooter contexts and shot counts — from single-shot calibration recordings
to 10-shot series with multiple lifts. Files are named with the session
timestamp and a shot/condition suffix (e.g. _5_skott, _10shots_3raises,
_4thdrag) so the collection context is preserved alongside the data.
Technologies used
Data collection
- Web HID API (navigator.hid)
- DualSense 6-axis IMU (gyro + accel)
- Bluetooth HID input/output reports
- CRC32 checksummed output reports
- Single-file HTML + vanilla JS
Visualization
- uPlot (high-performance charts)
- requestAnimationFrame batching
- Ring-buffer data structure
- Plotly (notebook exploration)
Annotation
- Label Studio (TimeSeries template)
- Five-phase shot taxonomy
- Per-channel stroke colours
- Brush-based region labelling
Analysis
- pandas (resample, interpolate)
- ruptures (Dynp, l2 change-point)
- Plotly Express
- Jupyter / itables
- uv (package management)
Status: the Web HID collector streams live DualSense IMU data and exports CSV, Label Studio annotations mark the five shot phases across a growing dataset of recordings, and the notebook's change-point pipeline segments the gyro signal automatically. Active work is on extending the segmentation into a supervised phase classifier trained on the labelled data.